Making Sense of the Numbers: My Top 3 Quantitative Data Analysis Techniques
As part of my PhD research on how China’s Higher Education Exchange Programs (HEEPs) influence PNG’s bilateral relations with China, I’ve spent the last few months collecting survey data from students, alumni, and public servants who participated in various HEEPs. These include the Chinese Government Scholarship Program (CGSP), Chinese Language Programs (CLPs), Public Sector Training Programs (PSTPs), PNG’s STEM scholarships, district-sponsored students, and privately funded learners. Now, with survey responses coming in from across the country and abroad, the focus shifts to analyzing the data.
There are several statistical tools available for analyzing survey data, but not every technique is suited to every research project. Because my study uses an explanatory sequential mixed-methods design, the quantitative phase is not an end in itself—it informs the qualitative phase that follows. My goal is to choose analytical techniques that allow me to describe trends, compare experiences across groups, and identify patterns worth exploring in interviews. Based on the structure of my data and the nature of my research questions, I’ve chosen three core techniques: descriptive statistics, cross-tabulations with Chi-square tests, and ANOVA (Analysis of Variance).
The first technique—descriptive statistics—is foundational. It helps summarize who my respondents are, what types of programs they participated in, and how they rated various aspects of their experience. These statistics (frequencies, percentages, means, and standard deviations) will allow me to describe patterns in the data and answer my first supporting question: What is the nature and scope of HEEPs in PNG? For example, I’ll be able to show how many respondents studied under CGSP compared to those in CLPs or PSTPs, and how access to these programs varies by region or gender.
 |
| Pilot survey data showing respondents’ regions of permanent residence. |
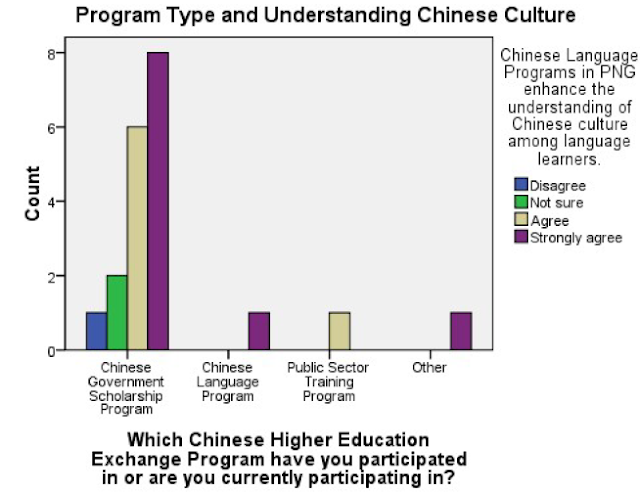
The second technique is cross-tabulation, which I’ll use in combination with Chi-square tests of independence. This method will allow me to examine relationships between categorical variables. For instance, I can explore whether students from different regions or program types report different levels of accessibility or perceived impact on foreign policy. The Chi-square test helps determine whether the differences observed across groups are statistically significant or simply due to chance.
The third method I plan to use is ANOVA, especially for analyzing Likert scale responses. Many of the survey questions ask participants to rate their experiences and perceptions on a scale. ANOVA will allow me to test whether there are significant differences in these average ratings between multiple groups—such as between CGSP students, CLP participants, and PSTP trainees. This is particularly important for my second and third research questions, which explore how these programs influence PNG’s foreign policy and shape broader bilateral ties.
 |
| There is no strong evidence that different groups perceive the CGSP's role in fostering goodwill differently. |
I have not chosen more advanced methods such as regression analysis or factor analysis because my primary aim is not to predict outcomes but to explore patterns and inform qualitative follow-up. These advanced techniques also require larger datasets and more assumptions than may be appropriate given my sample size and mixed participant groups. My priority is clarity and relevance, not complexity for its own sake.
Another reason for selecting these three techniques is that they are transparent and easy to interpret. This is especially important when sharing findings with policymakers, institutional stakeholders, and academic audiences. Descriptive statistics provide a clear summary of the data. Cross-tabulations help uncover group-based insights. ANOVA offers a useful way to compare perceptions and experiences across different categories of respondents.
By combining these three tools—descriptive statistics, cross-tabulations with Chi-square, and ANOVA—I can build a strong analytical foundation that connects directly to my research questions. These methods allow me to go beyond surface-level observations and generate evidence-based insights about how HEEPs are shaping the views and experiences of Papua New Guineans who engage with China through education.

Comments
Post a Comment